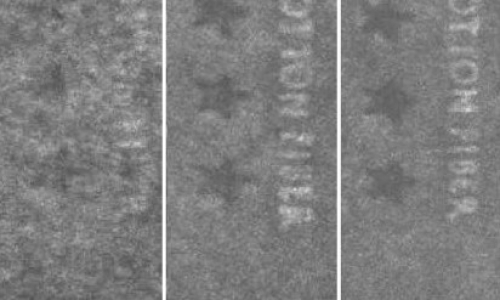
The OpTest "Watermark Quality Analysis Software" revolutionizes the way in which papermakers may optimize watermark quality! Using advanced algorithms, Watermark Quality Analysis Software quickly measures the Sharpness and Intensity of a watermark relative to a reference watermark or its artwork. This must be used in conjunction with the Micro-Scanner or the Paper PerFect Formation Analyzer.
Translation provided by Google
Watermark Quality Analysis Software (WQA) - OpTest
Watermark Quality Analysis Software (WQA)
| Product Name | Watermark Quality Analysis Software (WQA) |
| Product Code | LPB02 |
| Test Material | Paper, Tissue, Board |
| Manufacturer | OpTest Equipment Inc. |
| Availability from OpTest | Worldwide |
Watermarks provide security features and/or product identification in paper. Watermarks are traditionally examined using visual testing.
Visual assessment lacks sufficient precision and sensitivity to optimize quality and maintain the papermaking performance.
A definition of a good watermark depends upon the product end-use: sharp watermarks may be desired for security papers and undesired for some printing papers. Consequently, watermark quality analysis usually requires a reference watermark image for comparison.
Watermarks are imaged in transmitted light with the PPF or Micro-scanner, and images stored. The stored Sample images are opened by the Watermark Image Analysis software. The Watermark Intensity Ratio and Sharpness Difference are then determined relative to a Reference image. The results include:
• The Background Formation quality, %COV
• Sample Watermark %-Intensity
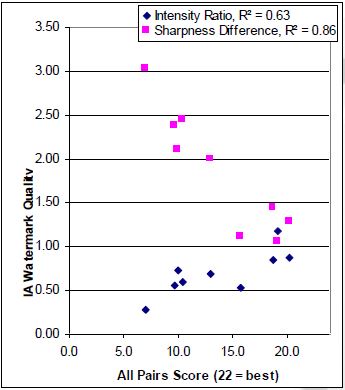
• The Intensity Ratio of the Sample watermark relative to the Reference. If greater than 1, then Intensity of the Sample is greater than the Reference, and vice versa.
• The Sharpness Difference of the Sample relative to the Reference. If the value is positive, then the Sharpness of the Reference watermark is greater than the Sample
ADVANTAGES
• Comparison with watermark’s artwork, or with user selected reference watermarks
• Windows™ based, bitmap storage and retrieval, Excel™ ready data and print-outs
• Faster, more precise and objective compared to visual testing
• Highly correlated with visual assessment
Results of Watermark Quality Analysis software are highly correlated to Cisual all pairs ranking.
The Watermark Quality Analysis Software display after the sample has been aligned with the Reference.

SYSTEM REQUIREMENTS
Computer:
• PC Workstation: operating with latest version of Windows™ and containing at least 16GB of RAM, 2 ea. USB port (USB 2.0 or later) and Microsoft Excel™ (2016 or later).
Optics Platform:
• Paper PerFect Formation Analyzer
• Paprican Micro-Scanner
or,
• Camera with IR filter and an optical resolution of 70 to 150 μm /pixel
• A pixel array of 480 H x 480 V
• Pixel signal of 256 GL (8 bit, monochrome)
• Average Signal Level: 50 +/- 3% of Full Scale (i.e. 128 GL in 8 bit sensitivity)
• Lighting non-uniformity < 1% (after mapping)
• Resulting images saved as a bitmap (*.bmp)
OPTIONS
• Paper PerFect Formation Analyzer
• Paprican Micro-Scanner
• Software: Excel and/or Photoshop

