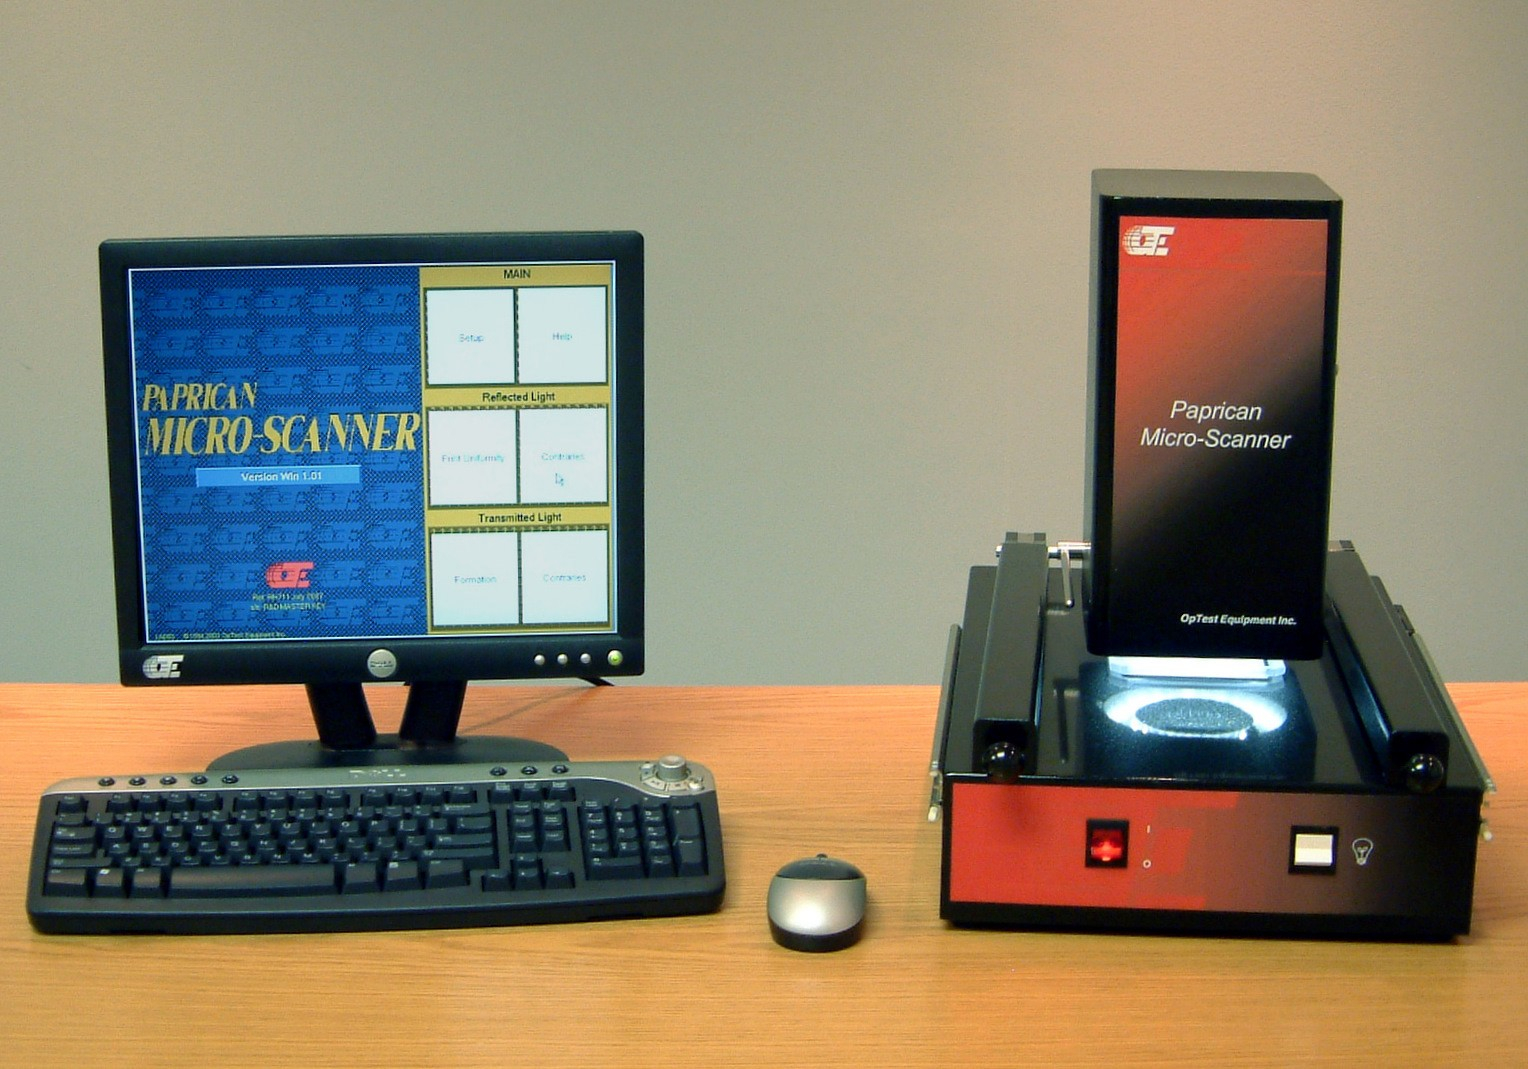
The Micro-Scanner was developed by FP Innovations (Paprican). It is a compact, multi-function, camera based digital image analyzer.
The Micro-Scanner measures:
• Visible Dirt (Physical and EBA)
• Light & Dark Contraries in reflected or transmitted light
• Sheet Formation
• Solid Print Uniformity
Camera based image analyzers have superior depth of field which easily accommodate rough or poorly formed sheets.
The Micro-Scanner uses a CCD camera with 65 μm/pixel resolution and high fidelity optics. The sample is illuminated in either of two ways:
• Circular-diffuse light (380 nm - 740 nm), for dirt and print non-uniformity tests, using white LED's providing reliability and precision. or
• Diffused high-intensity solid-state (LED) lighting system with feedback control for transmission through the sheet in formation testing. The feedback control automatically adjusts the intensity of the light source to accommodate large scale grammage variations.
ADVANTAGES:
• Camera, optics and illumination designed for precise dirt detection on smooth to very textured surfaces
• ‘Simple to use’ windows operation
• Rapid measurements over a wide range of pulp, tissue, paper and board grades and brightness
• Automatic profiling using strip feeder
• Inspection of handsheets
• Traceable calibration standards
• Auto calibration
• Excel™ based reports and data files
• Displays, stores, prints digitized images
DIRT SPECK ANALYSIS
Dirt speck analysis is, according to Tappi Method T563, Paptac Standard D.35.P and ISO 5350-4 “Measurement of Visible Dirt by Image Analysis”, to obtain the Equivalent Black Area (EBA) results. This is achieved with diffuse white light and local detection thresholding that eliminates shade correction and is independent of sheet brightness, formation and surface roughness. Both Physical Area (> 0.007 mm²) and EBA (> 0.010 mm²) results are reported.
These results include:
• Number of specks detected
• Average speck size (mm²)
• PPM (mm²/m²)
• Counting uncertainty (%)
• Speck size distribution histogram
The Physical Area results are typically used for process optimization (i.e. screens remove dirt specks on the basis of mass and size, not colour). The EBA results are used in making grade or customer specifications.Full calibration is automatic and takes less than 10 seconds. The threshold setting is automatic and adheres to ISO, TAPPI and Paptac methods. Dirt calibration standards for TAPPI / Paptac / ISO Equivalent Black Area are included.
The precision of the Micro-Scanner meets or exceeds that given in the ISO, TAPPI and Paptac methods.
SOLID PRINT ANALYSIS
The solid print uniformity analyses the density variations in a solid print in the same manner as the formation routine except that reflected light is used. Some applications have included:
• Print mottle
• K&N test analysis
• Graphite rub test analysis
• “White-top” liner board analysis
FORMATION ANALYSIS
The Micro-Scanner uses diffused transmitted light to analyse sheets (from 15 g/m² tissue to 1500 g/m² bleached board) for variations in optical density. The optics, with IR filters, are matched with the CCD sensors for maximum sensitivity. The formation quality results include:
• The %-contrast intensity between “flocs”
• Specific perimeter of detected features (flocs)
• Formation index dependent on both the floc size and contrast
• Adjustable floc size distribution histograms
• Cross machine direction profile results
TRANSMITTED LIGHT CONTRARIES
Contraries detected with transmitted light are either dark or light. Examples of dark contraries are opaque contaminants such as coating flakes. Examples of light contraries are pin holes and transparent points in the sheet (i.e. windows, “fish eyes”, etc). The results are reported in the same manner as for physical dirt analysis.
DIMENSIONS
• 61cm (24") L x 63cm (25") W x 44cm (17.5") H
• 27 kg (60 lbs)
CONNECTIONS
• 120Vac/60Hz or 240Vac/50Hz, 1 phase, 600 W min. The power must be stable, within 2%, and transient free within ± 10%
• Computer with the latest Versions Windows™ and Microsoft Office™ (2016 or higher) and one USB 3 port
OPTIONS
• Fully validated computer
• Touch screen display