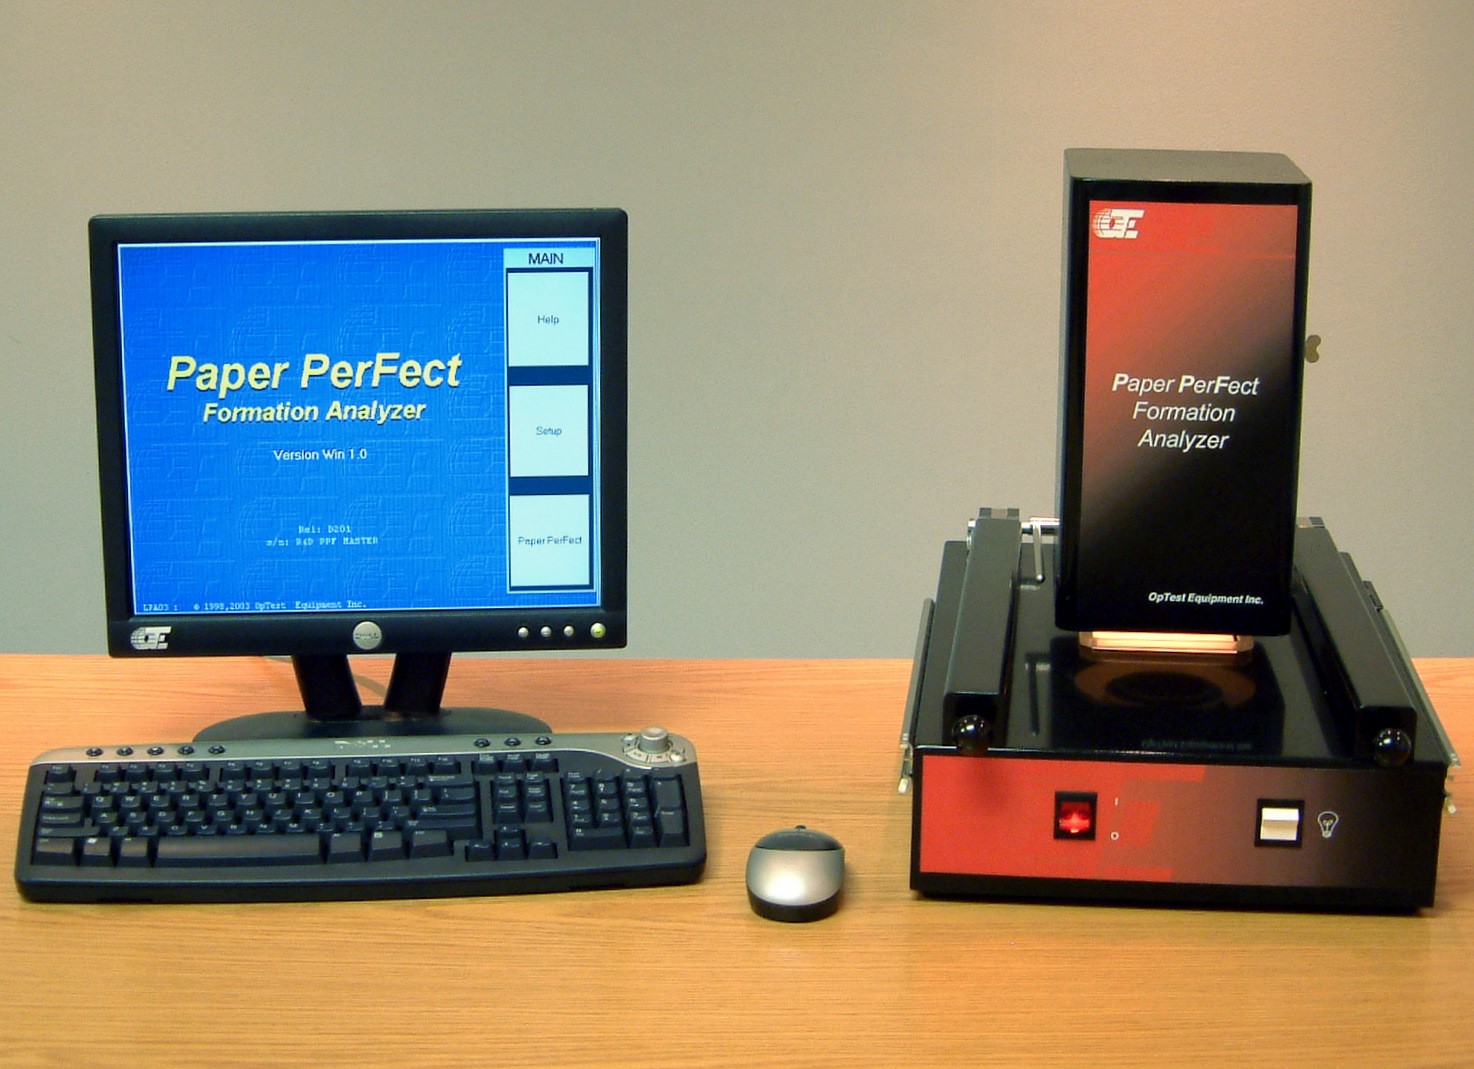


PPF (Paper PerFect Formation Analyzer)
Description
Paper PerFect Formation Analyzer (PPF) revolutionizes product quality optimization and productivity by measuring the sheet uniformity at different “scales of formation”. The results have been shown to correlate very well with visual assessment as well as with other physical properties of paper.
Paper PerFect Formation Analyzer (PPF) revolutionizes product quality optimization and productivity by measuring the sheet uniformity at different “scales of formation”!
With the PPF, papermakers are able to rapidly optimize formation in ways unachievable with traditional single index instruments. The PPF quantifies formation into its component values. Individual component values correlate well with paper and board properties such as strength and printability.
The PPF Formation Values are relative to “perfect paper” and to user selected “reference sheets”.
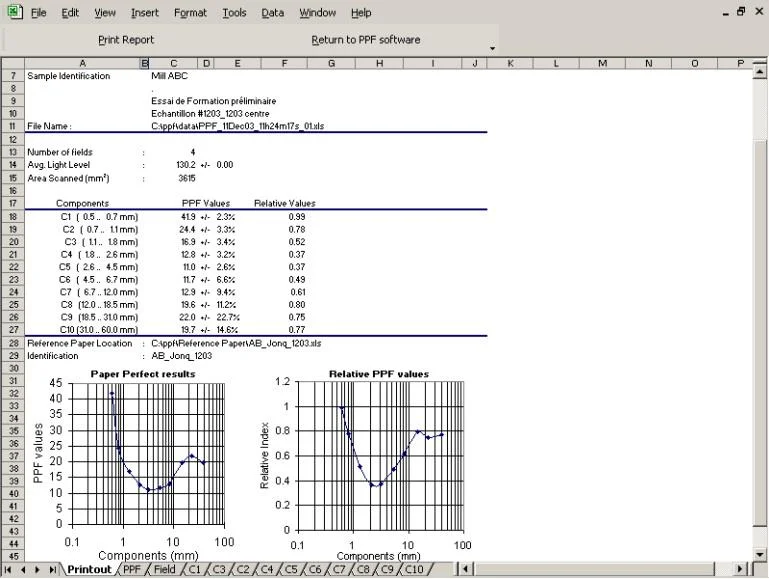
Samples are easily compared to selected reference sheets such as a competitor’s paper or the “best” sheet produced on a particular paper machine. The Relative Formation Values are reported for each size component. If this value is one, then the formation of the tested paper and reference paper are equal. If the value is greater than one, then the tested paper is better than the reference paper, and vice versa. Relative Formation measurements save time and money when determining the difference between sheets and when optimizing the paper machine forming sections.
ADVANTAGES
Quality Improvements
• Print quality
• Sheet strength
• Higher opacity
• Press room performance Production Improvements
Increased machine throughput
• Improved runnability
• Fewer rejects Formation Quality Results
Formation values from 0.4mm to 60mm
“floc” or component size ranges
Excel™ based reports and data files
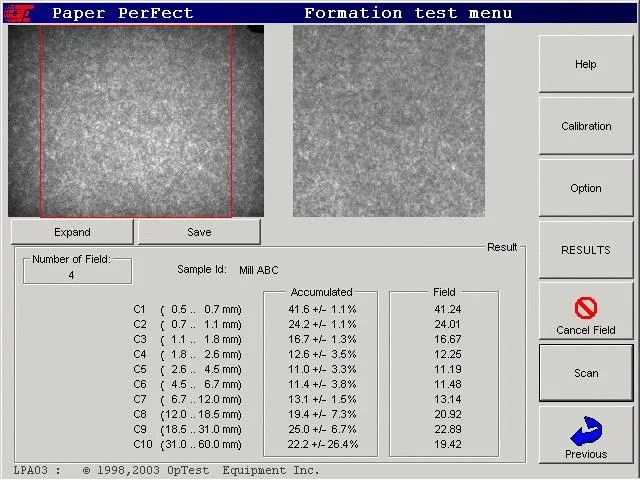
Displays, stores & prints digital images
Formation quality values are reported for each of the 10 components (size ranges) of formation:

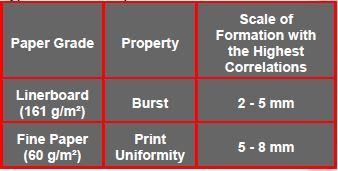
Process changes affect formation values, at different size ranges. Likewise, different size ranges relate to different sheet properties.
Typical Relationships:
ACKNOWLEDGEMENT
The advanced algorithms were developed at McGill University by Dr. J-Ph Bernié and Prof. M. Douglas (US Patent 6,301,373).
FEATURES
• Precise optics & illumination
• CCD camera with 65 µm/pixel resolution
• Auto calibration
• Diffused high-intensity solid-state (LED) lighting system and automatic intensity control
• Paper strip profiling capability
• Rapid measurements (< 1 s / field)
• 15 g/m² – 1500 g/m² grammage range for virgin furnishes
OPTIONS
• Fully validated “turn-key” computer
• Pattern Recognition Software
• Watermark Quality Analysis Software
DIMENSIONS
• Light Control Unit
• 61cm (24″) L x 63cm (25″) W x 44cm (17.5″) H
CONNECTIONS
• 120Vac/60Hz or 240Vac/50Hz, 1 phase, 600 W min. The power must be stable, within 2%, and transient free within ± 10%
•Computer with Microsoft Windows™ (Latest Versions), Microsoft Office™ (2016 or higher) and 1 USB 3 port.
- Watermark Quality Analysis Software
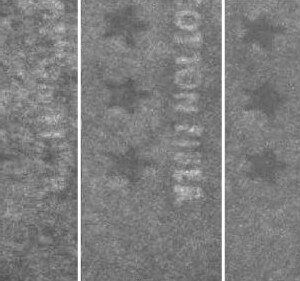
The OpTest “Watermark Quality Analysis Software” revolutionizes the way in which papermakers may optimize watermark quality! Using advanced algorithms, Watermark Quality Analysis Software quickly measures the Sharpness and Intensity of a watermark relative to a reference watermark or its artwork. This must be used in conjunction with the Micro-Scanner or the Paper PerFect Formation Analyzer. - OpTiPro Pattern Recognition
The OpTiPro analyzes periodic and quasi-periodic patterns in formed sheets with superior precision, speed, and sensitivity. The software is used in conjunction with the Paper PerFect Formation Analyzer or the Micro-Scanner - OpTiMaq Creases & Macro-fold Detection in Tissue
The OpTiMaq detects creases and macro-folds in tissue sheets with superior precision, speed, and sensitivity. The software is used in conjunction with the Paper PerFect Formation Analyzer or the Micro-Scanner.
- Watermark Quality Analysis Software
The OpTest “Watermark Quality Analysis Software” revolutionizes the way in which papermakers may optimize watermark quality! Using advanced algorithms, Watermark Quality Analysis Software quickly measures the Sharpness and Intensity of a watermark relative to a reference watermark or its artwork. This must be used in conjunction with the Micro-Scanner or the Paper PerFect Formation Analyzer. - OpTiPro Pattern Recognition
The OpTiPro analyzes periodic and quasi-periodic patterns in formed sheets with superior precision, speed, and sensitivity. The software is used in conjunction with the Paper PerFect Formation Analyzer or the Micro-Scanner - OpTiMaq Creases & Macro-fold Detection in Tissue
The OpTiMaq detects creases and macro-folds in tissue sheets with superior precision, speed, and sensitivity. The software is used in conjunction with the Paper PerFect Formation Analyzer or the Micro-Scanner.